
Dashboard & Reporting
Dashboard is the landing page for every operator user: a quick read on the fleet’s day, plus a set of reports for a deeper look at how the season is going.
Action bookings from your daily stats in the dashboard
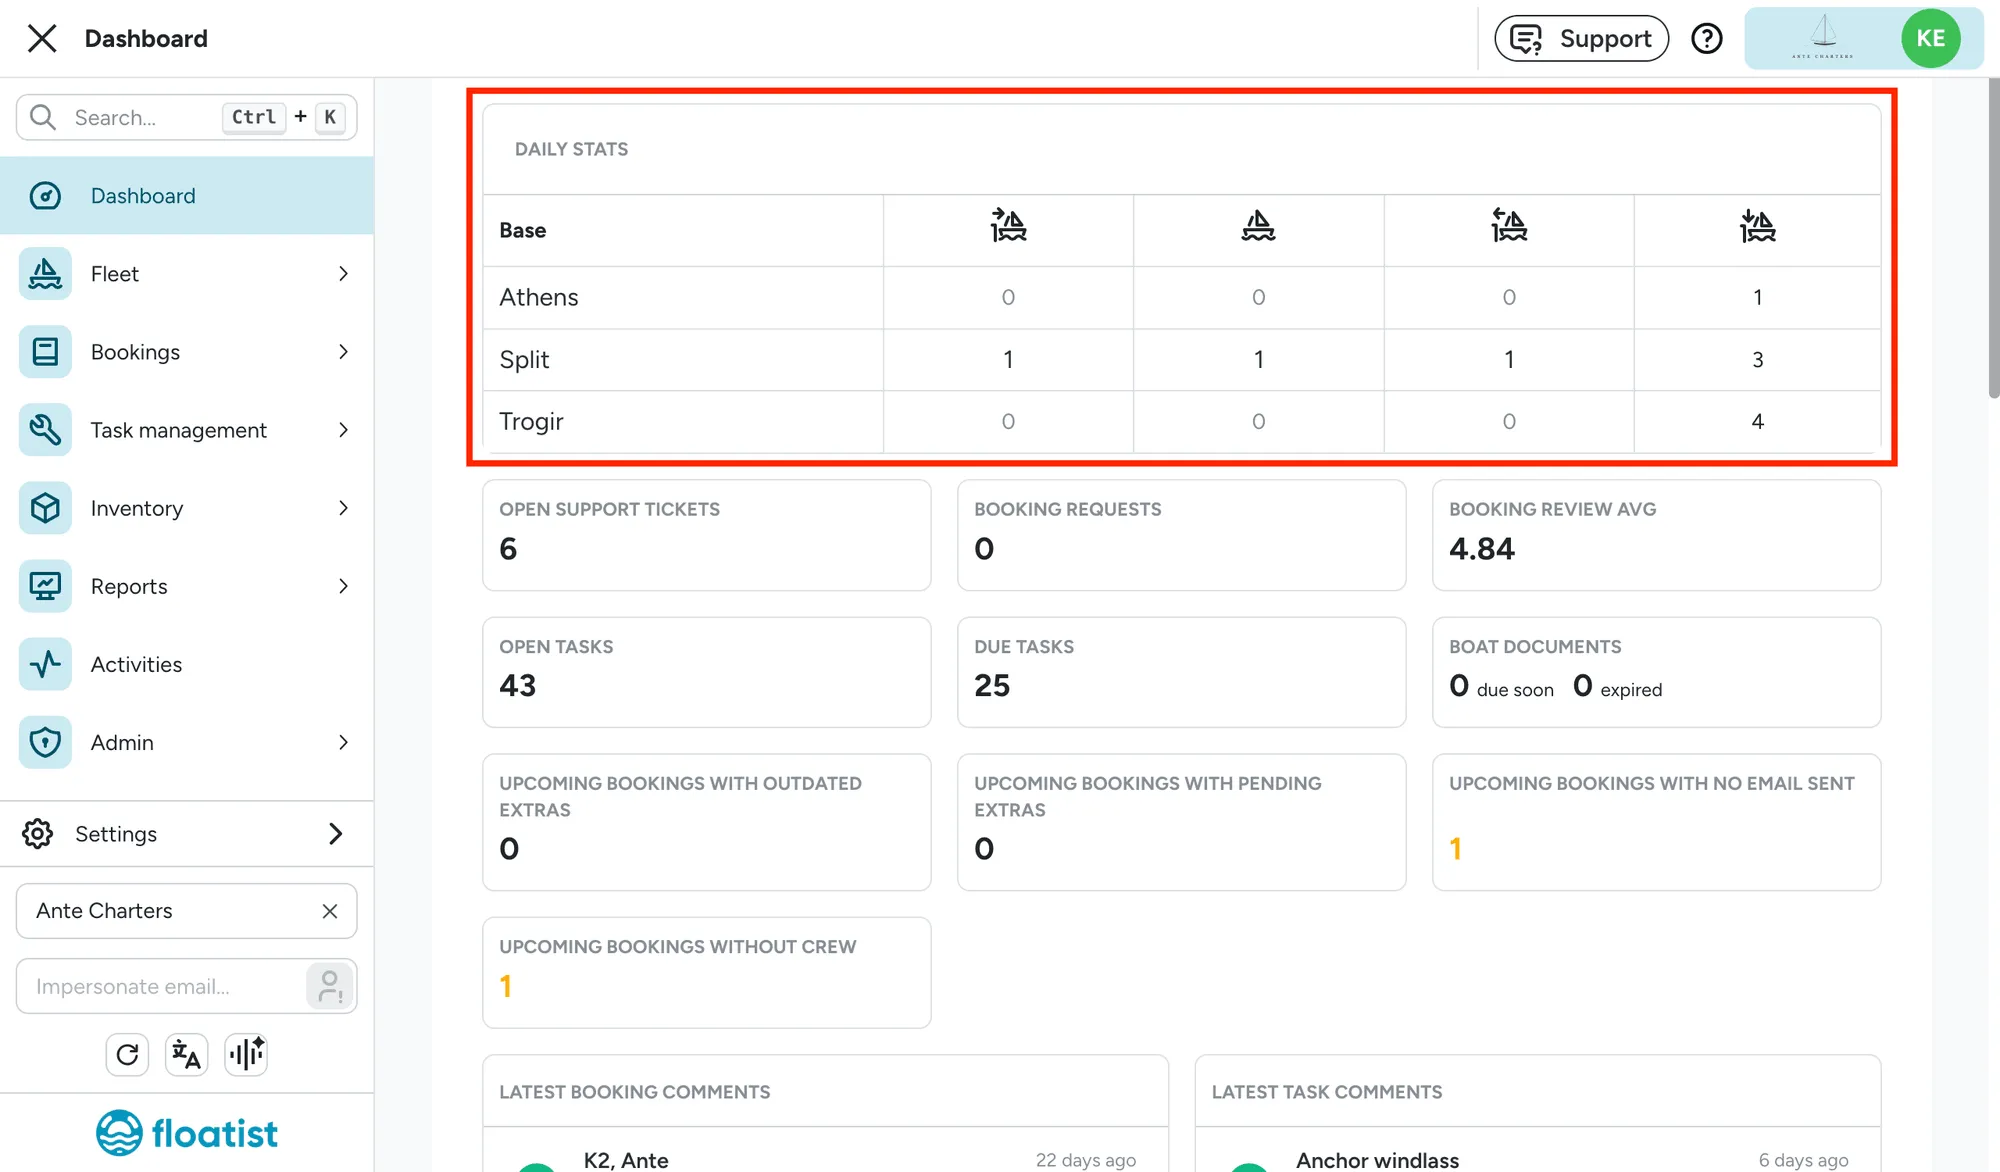
Section titled “Action bookings from your daily stats in the dashboard”Dashboard opens on a table with one row per base, showing how many boats are departing today, arriving today, out on charter, and staying idle at home. Click a base’s name to see everything touching that base today, or a column’s header icon for that same count across the whole fleet. Both open the bookings list, pre-filtered to exactly the bookings being counted. A count of zero is shown plain, not as a link, since there’s nothing to open.
Fleet utilization report
Section titled “Fleet utilization report”Reports > Fleet utilization shows how well your fleet sold this season against a season you pick to compare it with. It’s useful for judging how the season is going, or how it ended up once it’s over.
- Season and Compare with: pick the season to look at and the season to compare it against
- Daily / Weekly: toggle the chart’s granularity; weekly smooths the curve, it doesn’t change the season’s totals
- Home base and Boat type filters: scope the report to part of your fleet
Looking at a single season
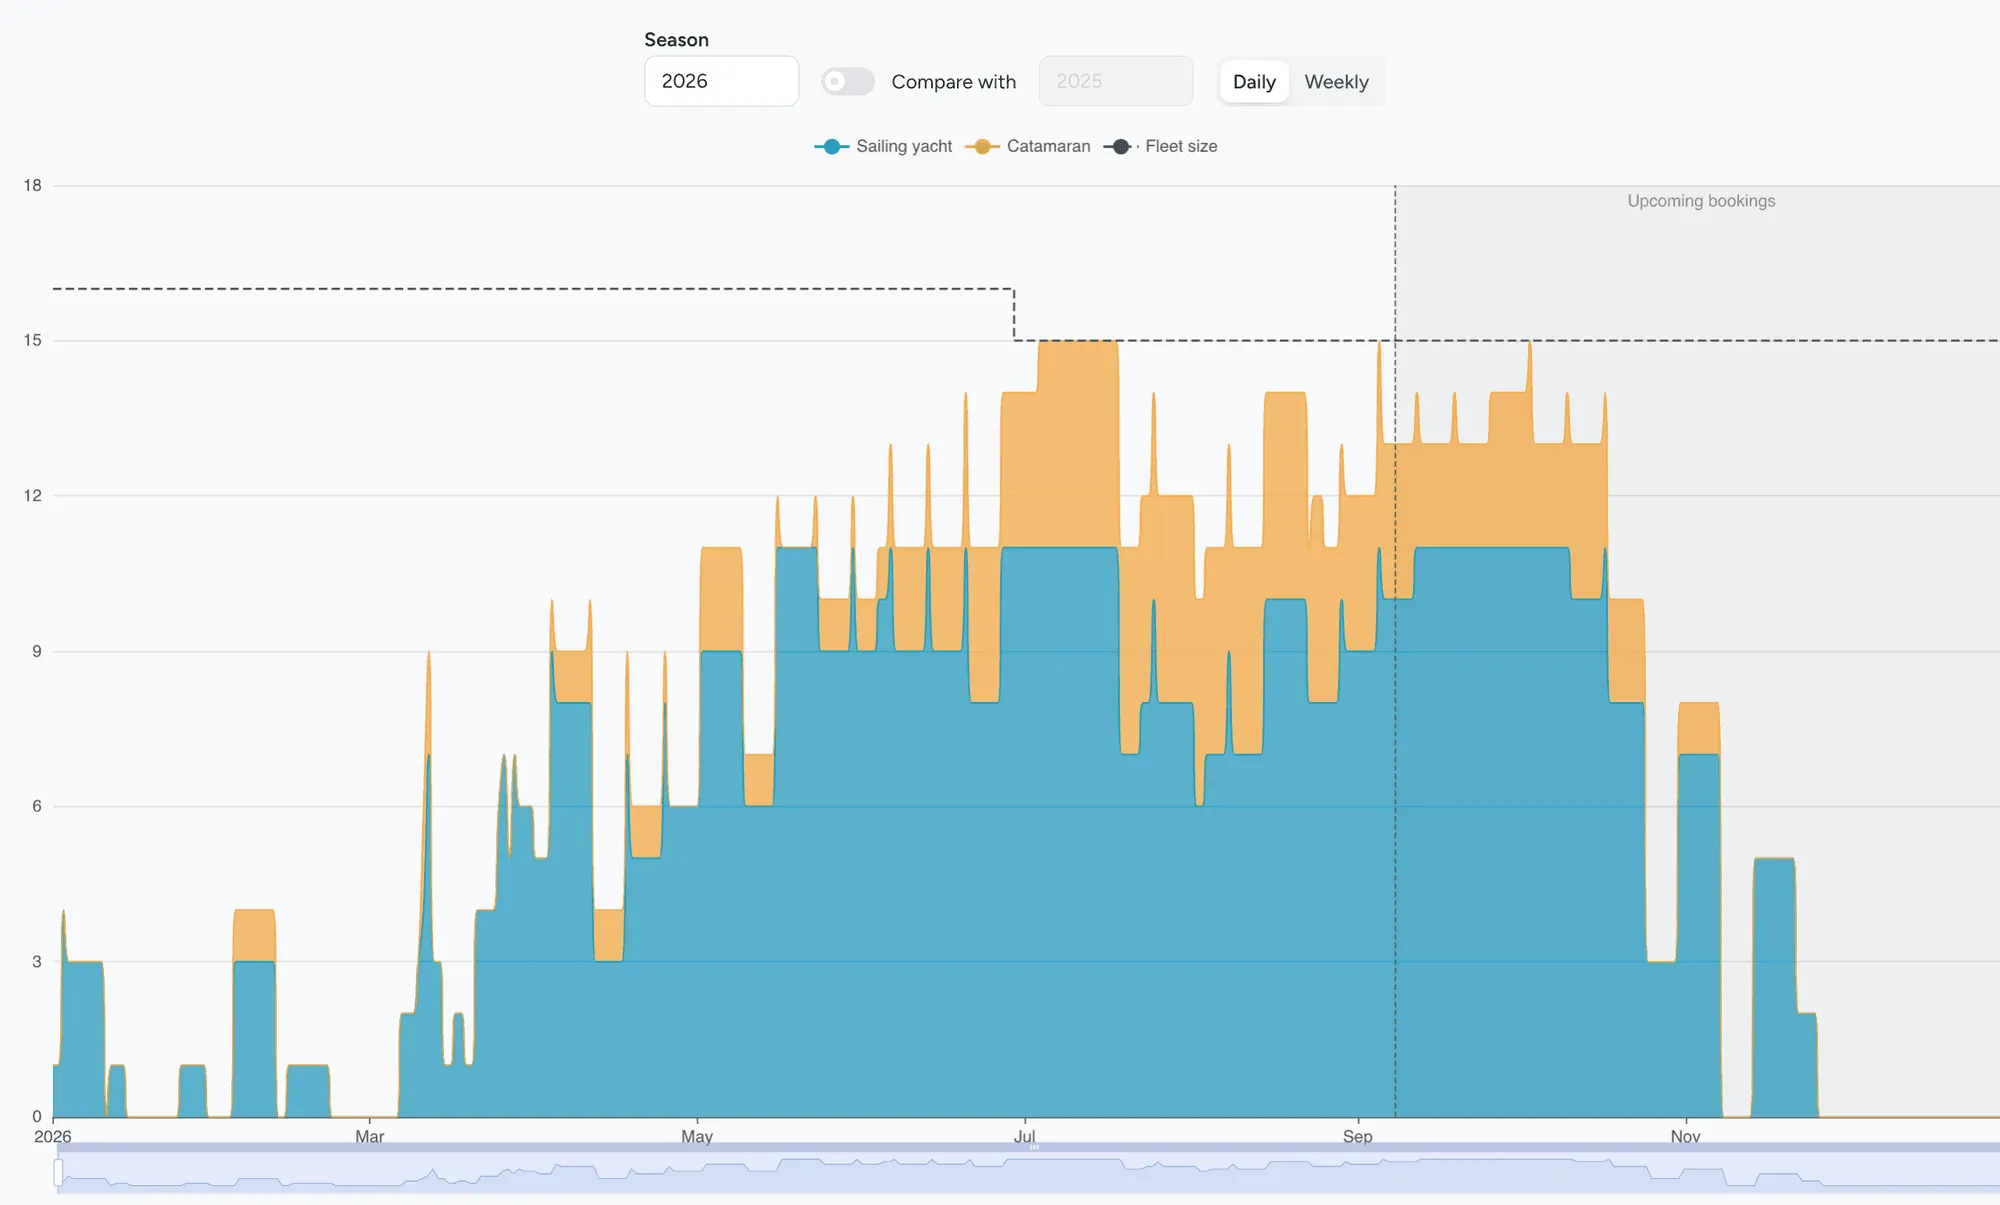
Section titled “Looking at a single season”With Compare with off, the chart plots boats on the water per day for the season alone, split by boat type, with a dashed line marking the fleet’s total size over time.
Comparing two seasons
Section titled “Comparing two seasons”Turn on Compare with to line the season up against another one. A green or red band fills the gap between the two seasons’ curves (green where the season you’re looking at is ahead, red where it’s behind), and three figures summarize the whole season above the chart:
- Utilization: booked boat-days divided by available boat-days, so it holds up even if your fleet size changed between the two seasons
- Boat-days chartered: the raw total: one boat on the water for one day
- Week by week: how many charter weeks came out ahead, behind, or level, so a season that was broadly better reads differently from one carried by a single exceptional month
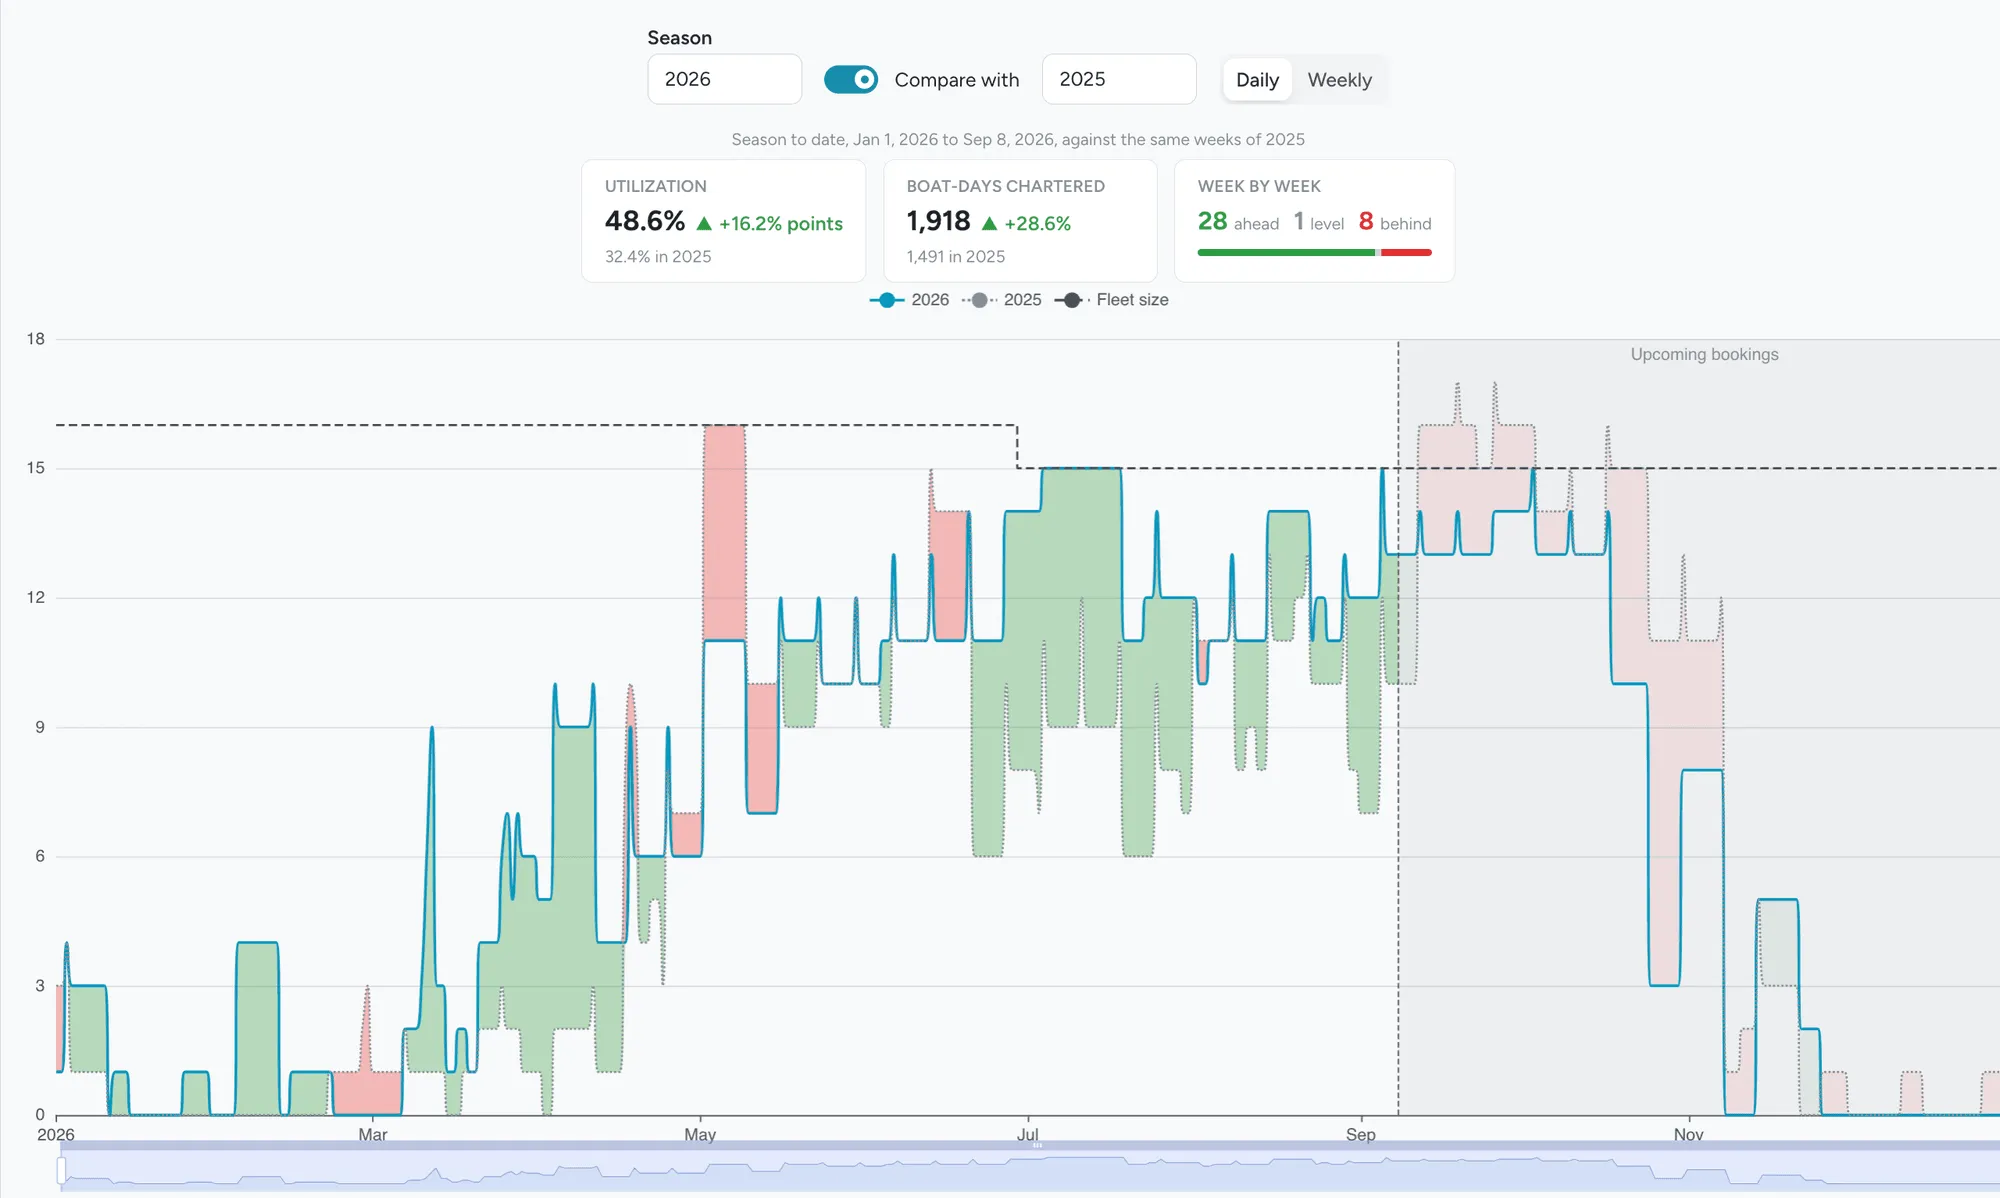
While the season is still running, the summary only totals up to today, compared against the same stretch of the comparison season (not the full year), so an in-progress season doesn’t read as a collapse next to a finished one.