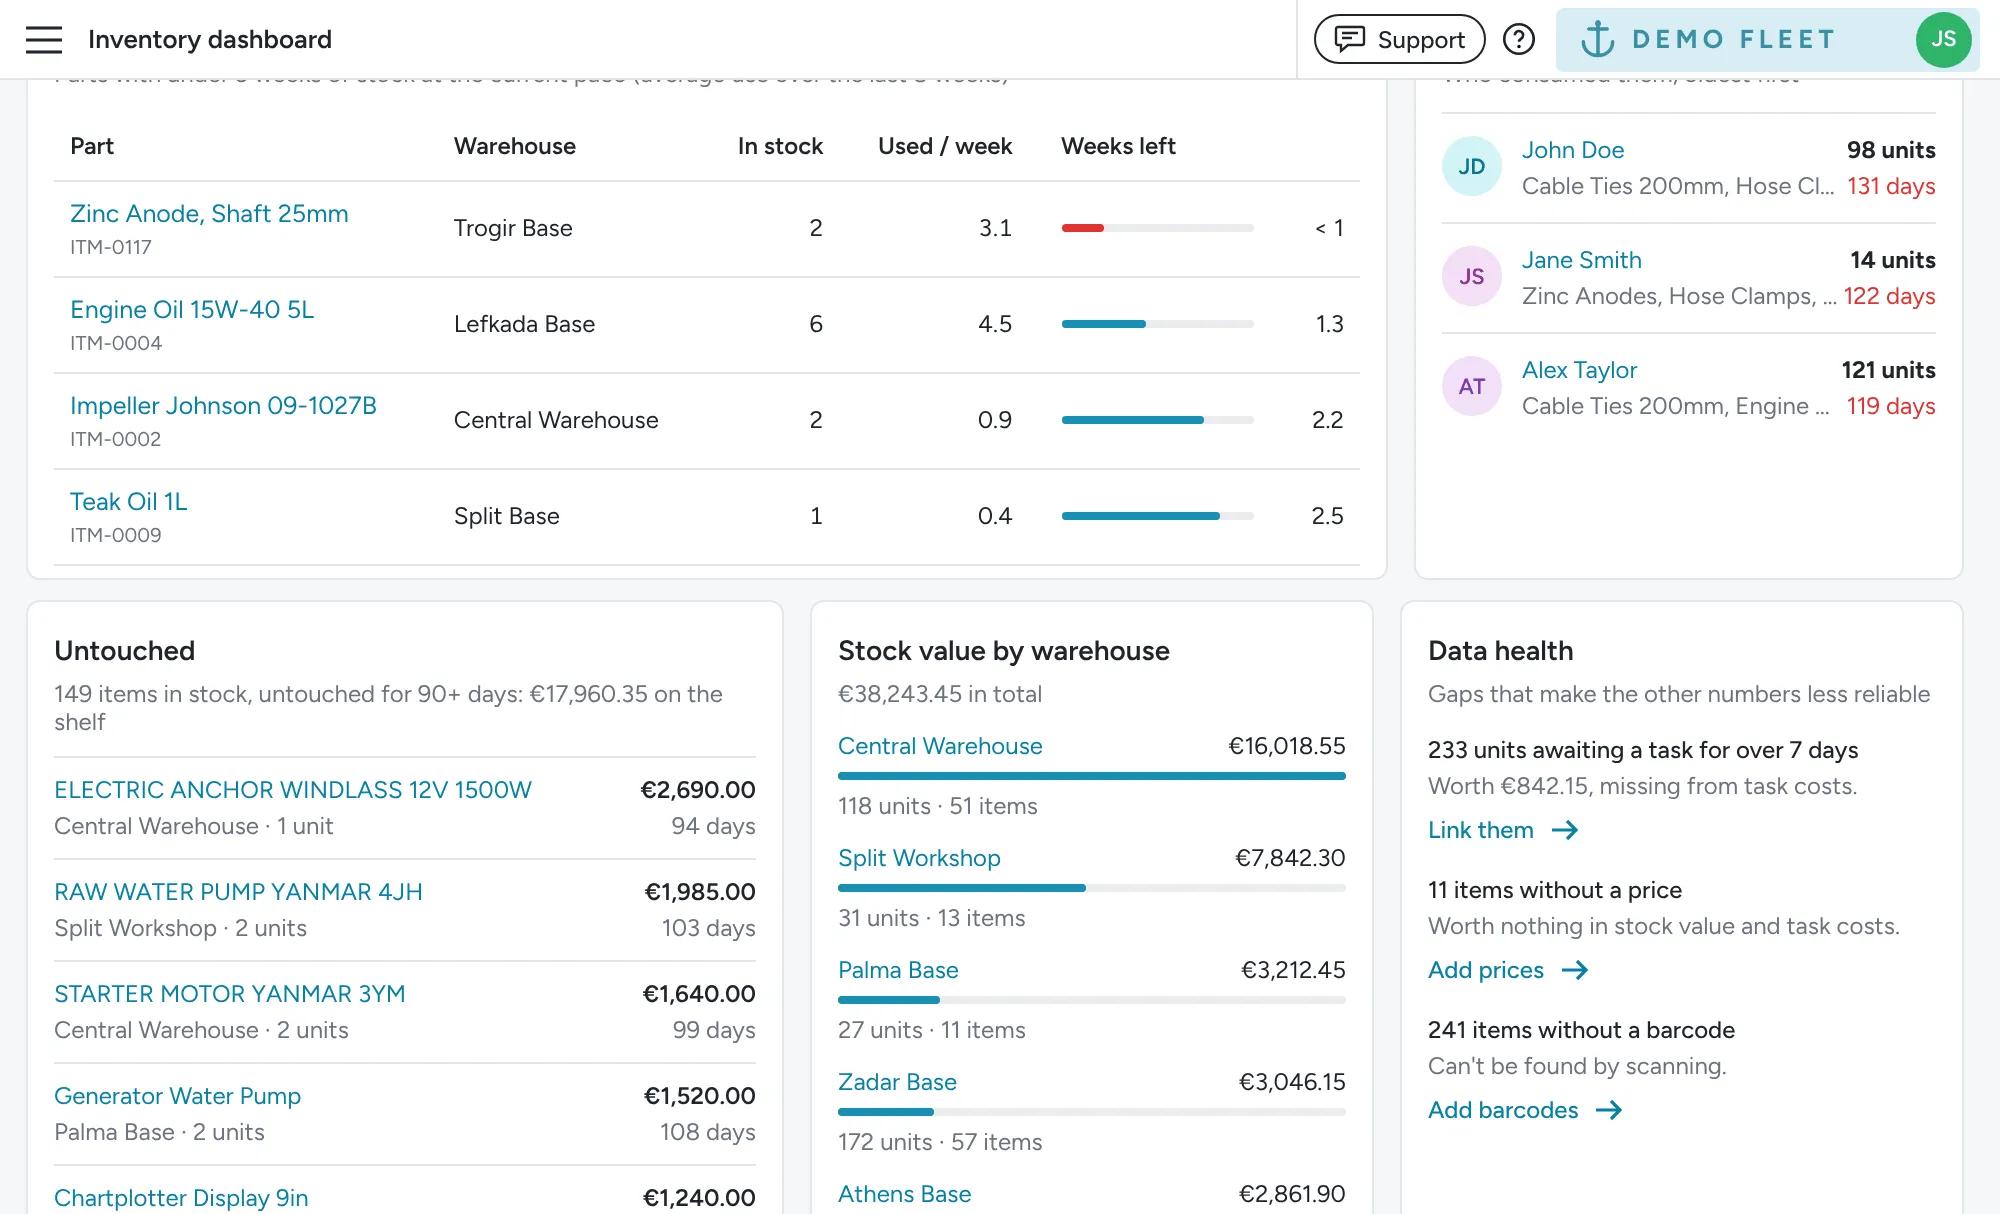
Dashboard
The Inventory > Dashboard page is the starting point for Inventory Management. It shows the state of your stock at a glance: what it is worth, what is running out, and where your stock went. Use the Warehouse selector at the top to look at one warehouse, or clear it to see all of them. The warehouse and period you pick are kept in the page address, so you can bookmark a view or send it to a colleague.
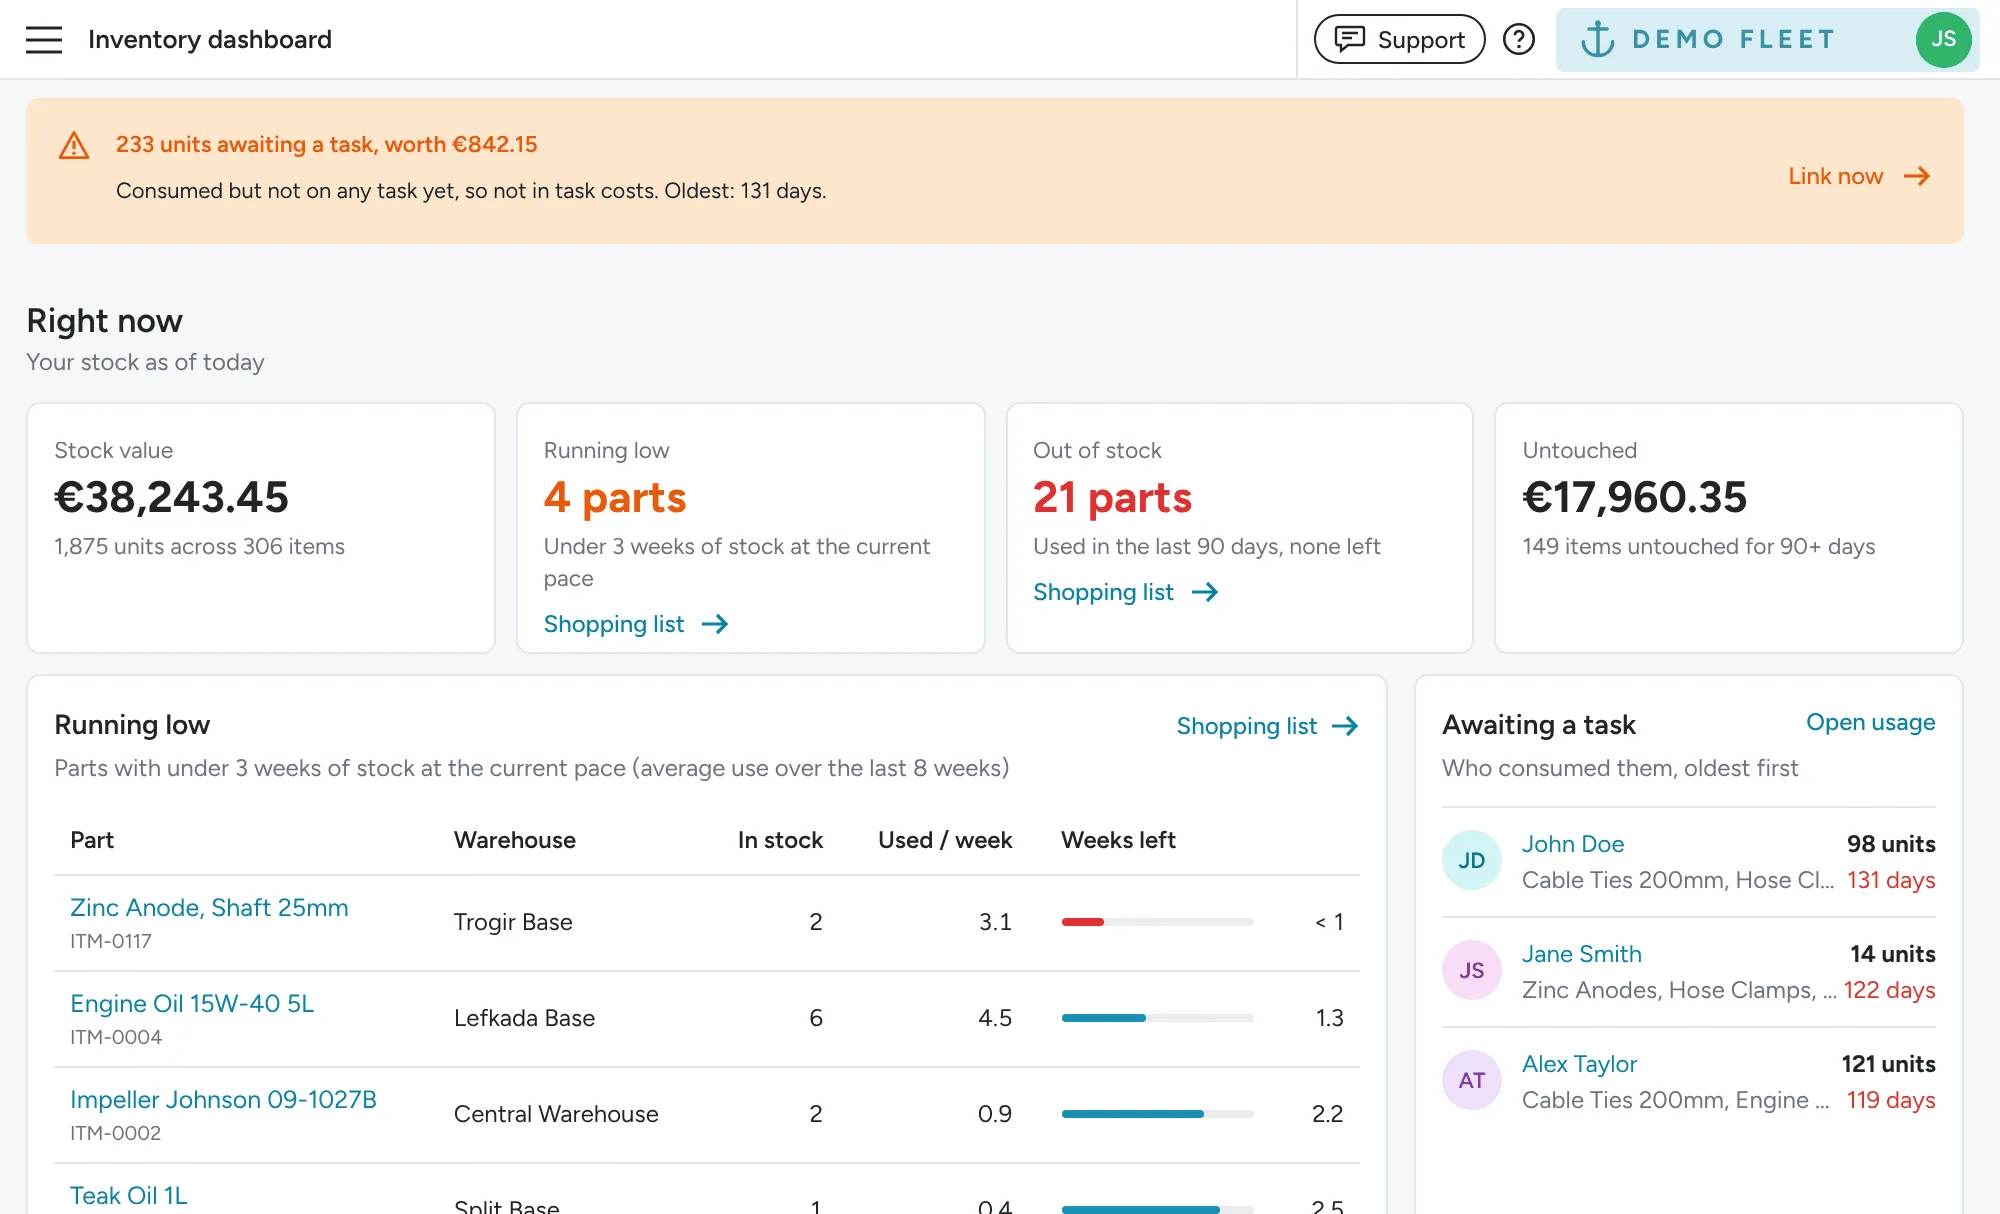
If units have been consumed but not yet added to a task, an orange banner at the top tells you how many, what they are worth and how old the oldest one is. Click Link now to open them on the Inventory > Usage page. Until they are on a task, they are missing from your task costs. See Usage.
Right now (Snapshot View)
Section titled “Right now (Snapshot View)”The Right now section shows your stock as of today. The period picker does not change it.
| Figure | What it shows |
|---|---|
| Stock value | The value of everything on the shelf, with the number of units and items |
| Running low | Items with less than 3 weeks of stock left at the current pace. See How running low is worked out |
| Out of stock | Items used in the last 90 days with none left |
| Untouched | Items in stock with no stock change for 90 days or more, and what they are worth |
| Awaiting a task | Who consumed stock that is not on a task yet, oldest first. Click a name to see that person’s pending usage |
| Stock value by warehouse | How your stock value splits across warehouses. Click a warehouse to filter the dashboard to it |
In this period
Section titled “In this period”The In this period section shows what was used in the period you pick (the last 30 days by default). Choose the last 7, 30 or 90 days, this month, this year or any dates. Each figure is compared with the same length of time just before.
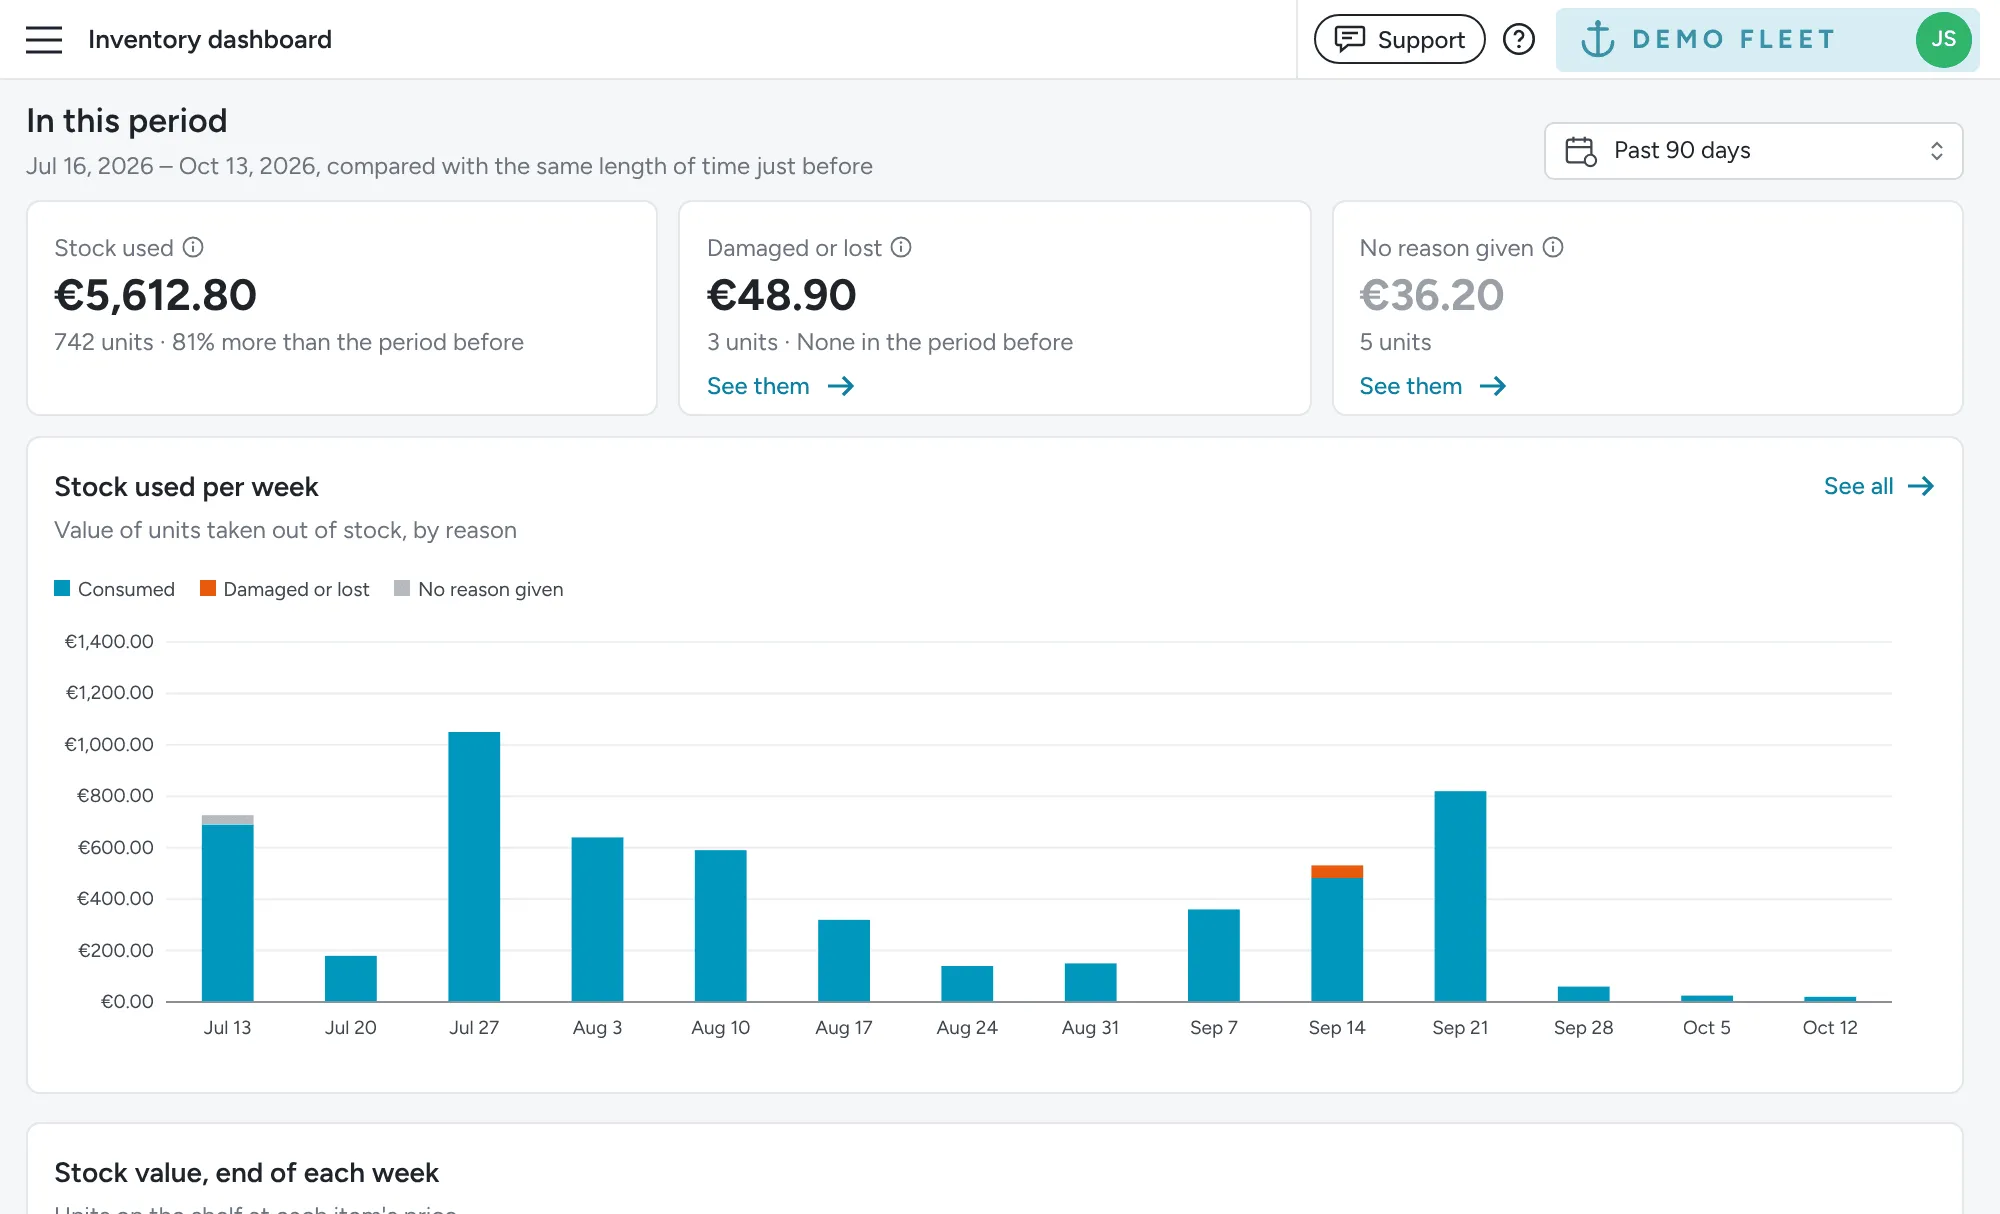
- Stock used: The value of units consumed or sold.
- Damaged or lost: Units taken out of stock as damaged or lost, counted apart from stock used.
- No reason given: Units taken out of stock without a reason. This only shows when there are some. Click See them to open those transactions and add the missing reasons.
- Stock used per day, week or month: A chart of the value of units taken out, by reason.
- Stock value, end of each day, week or month: A chart of your stock value over the period, so you see whether stock is building up or being run down ahead of the season.
- Cost by boat: What went on each boat’s tasks. Units awaiting a task, lost, or used on a task with no boat get rows of their own. Click a boat to see the stock it used.
- Most used parts: Your most used items by units, with their value.
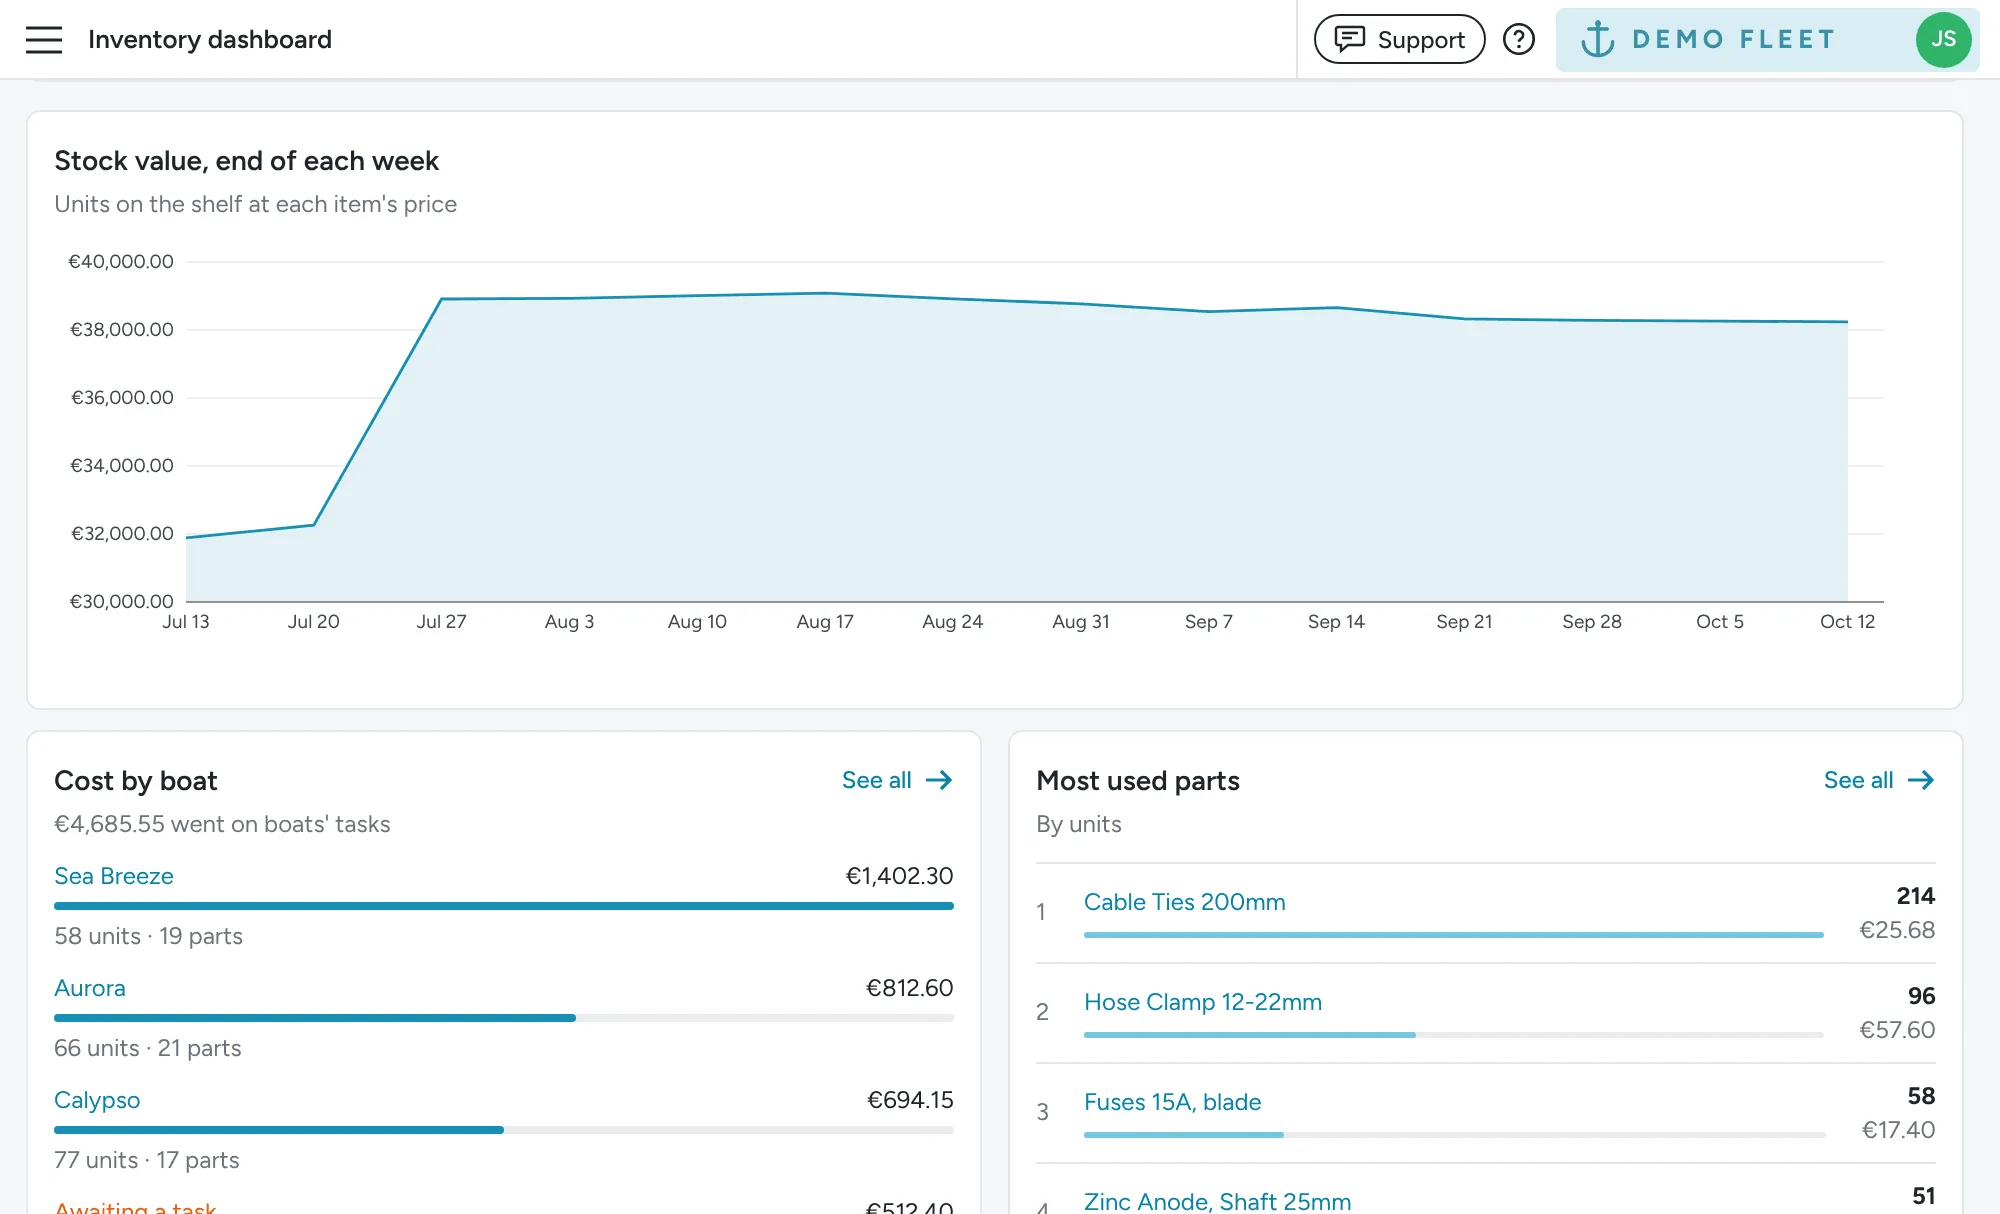
Click See all on any of these cards to open the usage summary with the same period and warehouse.
Data health
Section titled “Data health”The Data health card lists the gaps that make the other numbers less reliable. Each one links straight to the list where you can fix it:
- Units awaiting a task for over 7 days: Missing from task costs. Click Link them.
- Items without a price: Worth nothing in stock value and task costs. Click Add prices.
- Items without a barcode: Can’t be found by scanning. Click Add barcodes.
When everything is in order, the card says Nothing to fix.